Which one of the following graphs illustrates how capacitive reactance varies with frequency? 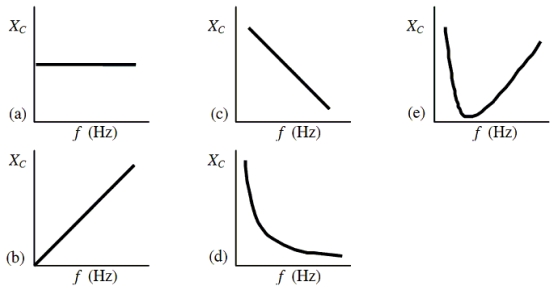
A) a
B) b
C) c
D) d
E) e
Correct Answer:
Verified
Q12: The graph shows the voltage across and
Q13: An ac generator is connected across
Q14: A variable inductor is connected to an
Q15: When the frequency of an ac circuit
Q16: Two 3.25-µF capacitors are connected in series
Q18: An ac voltage source that has a
Q19: The current in a certain ac circuit
Q20: Which circuit elements act to oppose changes
Q21: Which one of the following statements concerning
Q22: The table below shows the values of
Unlock this Answer For Free Now!
View this answer and more for free by performing one of the following actions

Scan the QR code to install the App and get 2 free unlocks

Unlock quizzes for free by uploading documents