Multiple Choice
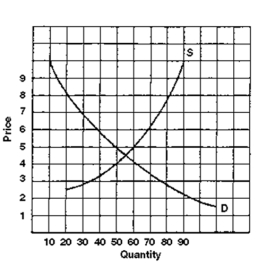
-In the graph shown above,at a price of $3.00
A) there is a shortage.
B) there is a surplus.
C) quantity supplied is greater than quantity demanded.
D) None of these choices are correct.
Correct Answer:
Verified
Related Questions
Q10: If supply increases and demand remains unchanged,equilibrium
Q11: A decrease in demand means that quantity
Q12: An increase in supply means that quantity
Q13: When the market price is higher than
Q14: If the equilibrium price of corn is
Q16: The market price _ the equilibrium price.
A)can
Unlock this Answer For Free Now!
View this answer and more for free by performing one of the following actions

Scan the QR code to install the App and get 2 free unlocks

Unlock quizzes for free by uploading documents