In the following table, 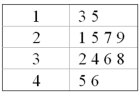
A) There are 16 observations.
B) There are four observations in the second class.
C) There are ten observations less than thirty.
D) There are ten observations greater than thirty.
Correct Answer:
Verified
Q41: The following table is a: 
Q42: A stem-and-leaf display includes the following row:
Q44: The following graph is a _.
Q45: Outliers are clearly presented in a _.
A)
Q46: What is the value of the Pearson
Q48: The following graph is _.
Q49: If the coefficient of skewness is equal
Q50: The following graph illustrates _.
Q52: Using the following statistics to describe a
Q58: What is the possible range of values
Unlock this Answer For Free Now!
View this answer and more for free by performing one of the following actions

Scan the QR code to install the App and get 2 free unlocks

Unlock quizzes for free by uploading documents