Exhibit 3-1
The following data show the number of hours worked by 200 statistics students. 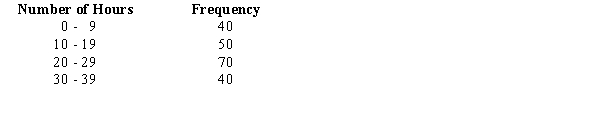
-Refer to Exhibit 3-1. The number of students working 19 hours or less
A) is 40
B) is 50
C) is 90
D) cannot be determined without the original data
Correct Answer:
Verified
Q95: Exhibit 3-2
A researcher has collected the following
Q96: Exhibit 3-2
A researcher has collected the following
Q97: The geometric mean of 1, 2, 4,
Q98: Exhibit 3-2
A researcher has collected the following
Q99: The geometric mean of 2, 4, 8
Q101: Exhibit 3-5
You are given the following frequency
Q102: Consider the data in the following frequency
Q103: Exhibit 3-4
The following is the frequency distribution
Q105: In 2012, the average donation to the
Q105: Exhibit 3-5
You are given the following frequency
Unlock this Answer For Free Now!
View this answer and more for free by performing one of the following actions

Scan the QR code to install the App and get 2 free unlocks

Unlock quizzes for free by uploading documents