Exhibit 3-4
The following is the frequency distribution for the speeds of a sample of automobiles traveling on an interstate highway. 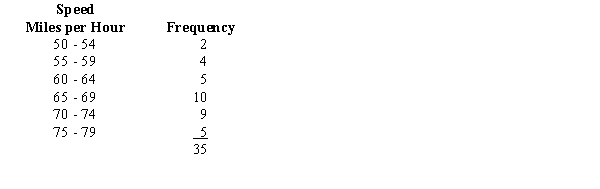
-Refer to Exhibit 3-4. The standard deviation is
A) 6.969
B) 7.071
C) 48.570
D) 50.000
Correct Answer:
Verified
Q108: The average wage of Tennessee cashiers is
Q115: Exhibit 3-3
A researcher has collected the following
Q116: Exhibit 3-5
You are given the following frequency
Q117: Exhibit 3-6
The closing stock price of MNM
Q118: Exhibit 3-4
The following is the frequency distribution
Q119: Exhibit 3-6
The closing stock price of MNM
Q122: The amount of time that a sample
Q123: For the following frequency distribution (assume the
Q124: The starting salaries of a sample of
Q125: The following data represent the daily demand
Unlock this Answer For Free Now!
View this answer and more for free by performing one of the following actions

Scan the QR code to install the App and get 2 free unlocks

Unlock quizzes for free by uploading documents