You have collected data from Major League Baseball (MLB)to find the determinants of winning. You have a general idea that both good pitching and strong hitting are needed to do well. However, you do not know how much each of these contributes separately. To investigate this problem, you collect data for all MLB during 1999 season. Your strategy is to first regress the winning percentage on pitching quality ("Team ERA"), second to regress the same variable on some measure of hitting ("OPS - On-base Plus Slugging percentage"), and third to regress the winning percentage on both.
Summary of the Distribution of Winning Percentage, On Base plus Slugging Percentage,
and Team Earned Run Average for MLB in 1999 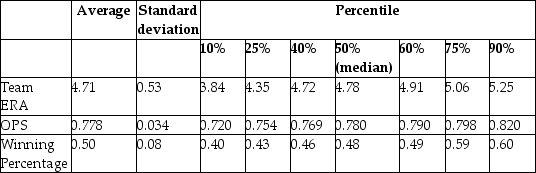 The results are as follows: = 0.94 - 0.100 × teamera, R2 = 0.49, SER = 0.06.
(0.08)(0.017) = -0.68 + 1.513 × ops, R2=0.45, SER = 0.06.
(0.17)(0.221) = -0.19 - 0.099 × teamera + 1.490 × ops, R2=0.92, SER = 0.02.
(0.08)(0.008)(0.126)
(a)Use the t-statistic to test for the statistical significance of the coefficient.
(b)There are 30 teams in MLB. Does the small sample size worry you here when testing for significance?
Correct Answer:
Verified
View Answer
Unlock this answer now
Get Access to more Verified Answers free of charge
Q16: The confidence interval for a single coefficient
Q17: A 95% confidence set for two or
Q18: All of the following are examples
Q19: The following linear hypothesis can be tested
Q20: If you wanted to test, using a
Q22: In the multiple regression model with
Q23: Consider a regression with two variables, in
Q24: In the process of collecting weight
Q25: The critical value of F4,∞ at the
Q26: A subsample from the Current Population
Unlock this Answer For Free Now!
View this answer and more for free by performing one of the following actions

Scan the QR code to install the App and get 2 free unlocks

Unlock quizzes for free by uploading documents