You are presented with the following output from a regression package, which reproduces the regression results of testscores on the student-teacher ratio from your textbook
Dependent Variable: TESTSCR
Method: Least Squares
Date: 07/30/06 Time: 17:44
Sample: 1 420
Included observations: 420 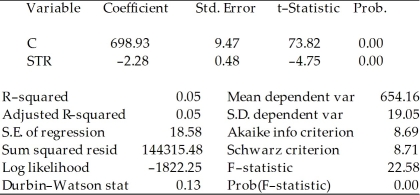 Std. Error are homoskedasticity only standard errors.
a)What is the relationship between the t-statistic on the student-teacher ratio coefficient and the F-statistic?
b)Next, two explanatory variables, the percent of English learners (EL_PCT)and expenditures per student (EXPN_STU)are added. The output is listed as below. What is the relationship between the three t-statistics for the slopes and the homoskedasticity-only F-statistic now?
Dependent Variable: TESTSCR
Method: Least Squares
Date: 07/30/06 Time: 17:55
Sample: 1 420
Included observations: 420 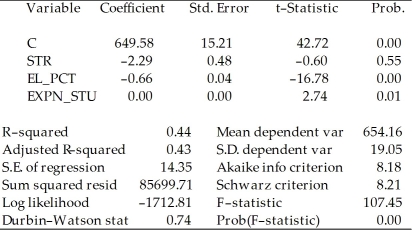
Correct Answer:
Verified
View Answer
Unlock this answer now
Get Access to more Verified Answers free of charge
Q38: All of the following are true,
Q39: The OLS estimators of the coefficients in
Q40: You have collected data for 104
Q41: Consider the following Cobb-Douglas production function
Q42: Consider a situation where economic theory suggests
Q44: The homoskedasticity only F-statistic is given by
Q45: Consider the following regression using the
Q46: Consider the following multiple regression model
Yi =
Q47: Explain carefully why testing joint hypotheses simultaneously,
Q48: Set up the null hypothesis and alternative
Unlock this Answer For Free Now!
View this answer and more for free by performing one of the following actions

Scan the QR code to install the App and get 2 free unlocks

Unlock quizzes for free by uploading documents