You have collected quarterly Canadian data on the unemployment and the inflation rate from 1962:I to 2001:IV. You want to re-estimate the ADL(3,1)formulation of the Phillips curve using a GARCH(1,1)specification. The results are as follows:
(.48) (.08) (.10) (.09)
(.15)
(a)Test the two coefficients for and in the GARCH model individually for statistical significance.
(b)Estimating the same equation by OLS results in
(.54) (.10) (.11) (.08)
Briefly compare the estimates. Which of the two methods do you prefer?
(c)Given your results from the test in (a), what can you say about the variance of the error terms in the Phillips Curve for Canada?
(d)The following figure plots the residuals along with bands of plus or minus one predicted standard deviation (that is, ± )based on the GARCH(1,1)model. 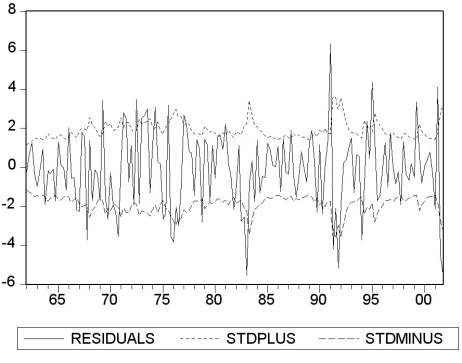 Describe what you see.
Correct Answer:
Verified
View Answer
Unlock this answer now
Get Access to more Verified Answers free of charge
Q28: Using the ADL(1,1)regression Yt = ?0
Q29: Some macroeconomic theories suggest that there is
Q30: You have collected quarterly data for
Q31: ARCH and GARCH models are estimated using
Q32: "Heteroskedasticity typically occurs in cross-sections, while serial
Q34: The lag length in a VAR using
Q35: The dynamic OLS (DOLS)estimator of the cointegrating
Q36: Purchasing power parity (PPP), postulates that
Q37: Assume that you have used the OLS
Q38: Volatility clustering
A)is evident in most cross-sections.
B)implies that
Unlock this Answer For Free Now!
View this answer and more for free by performing one of the following actions

Scan the QR code to install the App and get 2 free unlocks

Unlock quizzes for free by uploading documents