The following table shows the production and prices of an economy's only two goods,TVs and computers,in 2003 and 2009.Assume that 2003 is the base year.
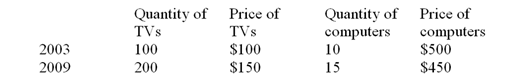
-What is the growth in real GDP over the period from 2003 to 2009?
A) 34%.
B) 78%.
C) 83%.
D) 138%.
E) 145%.
Correct Answer:
Verified
Q126: The following table shows the production and
Q127: The following table shows the production and
Q128: Peg's Manicure Manor did 4,000 sets of
Q129: If substantially more foreign investment income comes
Q130: A measure of the price level of
Q132: The following table shows the production and
Q133: Comparisons of GDP levels across countries are
Q134: Real GDP may be calculated by dividing
Q135: To calculate nominal GDP,the quantities of goods
Q136: A proposal to increase the age at
Unlock this Answer For Free Now!
View this answer and more for free by performing one of the following actions

Scan the QR code to install the App and get 2 free unlocks

Unlock quizzes for free by uploading documents