The chart shows the annual unemployment rates in Canada and the United States over the period 1968-2000.Use this information for the following question. 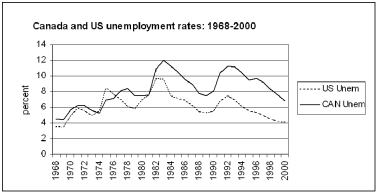
The two most striking aspects of the chart are ________ between the Canada-U.S.unemployment rates over the entire period and ________ between the Canada-U.S.unemployment rates after 1982.
A) a strong positive correlation;a large and persistent gap
B) a weak positive correlation;a large and persistent gap
C) a strong negative correlation;a large and persistent gap
D) a weak negative correlation;a large and persistent gap
E) a zero correlation;a large and persistent gap
Correct Answer:
Verified
Q64: The table below provides data about the
Q65: Microland has a population of 50 people;40
Q66: If the unemployment rate increases from 4%
Q67: When a country imports more than it
Q68: If tax revenues equal 20% of total
Q70: The inflation rate
A) was higher in the
Q71: While Canada has tended to run trade
Q72: The table below provides data about the
Q73: Fiscal policy refers to
A) decisions to determine
Q74: The standard of living is directly tied
Unlock this Answer For Free Now!
View this answer and more for free by performing one of the following actions

Scan the QR code to install the App and get 2 free unlocks

Unlock quizzes for free by uploading documents