The graphs below refer to the market for good X.Firms can produce either good X or good Y,which consumers consider to be a substitute for good X.A decrease in the price of good Y will to lead to the shifts shown by 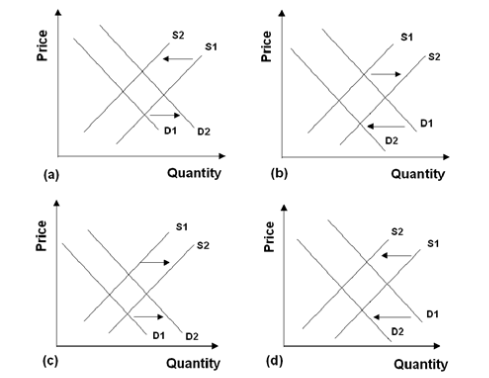
A) Graph (a) .
B) Graph (b) .
C) Graph (c) .
D) Graph (d) .
E) Both Graph (a) and Graph (d) .
Correct Answer:
Verified
Q165: The supply and demand model is not
Q166: One of the assumptions of the supply
Q167: Since 1990,per-capita income in China has risen.In
Q168: If both buyers and sellers expect the
Q169: In the mid-1990s,The Wall Street Journal reported
Q171: Refer to the graphs below.A recent report
Q172: Season tickets to the Toronto Maple Leafs
Q173: Suppose that a recent,widely-circulated medical article reports
Q174: One of the assumptions of the supply
Q175: If both buyers and sellers expect the
Unlock this Answer For Free Now!
View this answer and more for free by performing one of the following actions

Scan the QR code to install the App and get 2 free unlocks

Unlock quizzes for free by uploading documents