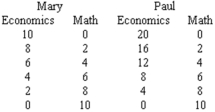
Refer to the graph below.Given Mary and Paul's production possibilities tables for answering economics and math problems,which curve represents their combined production possibilities curve if they take advantage of their comparative advantages? 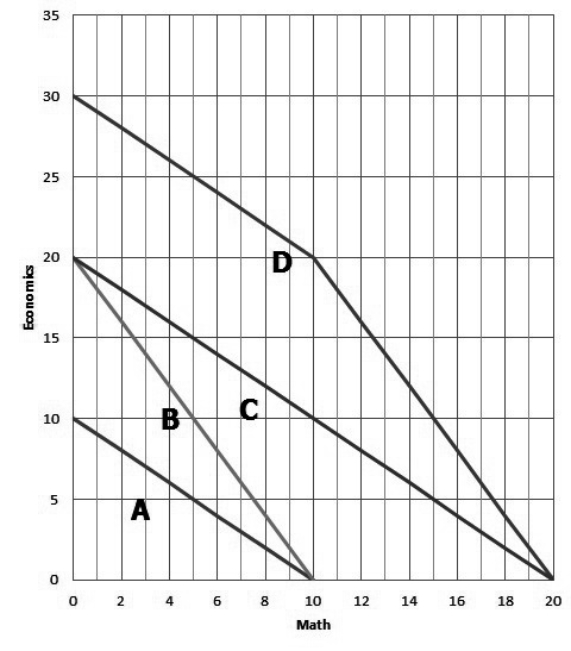
A) A
B) B
C) C
D) D
E) Not shown.
Correct Answer:
Verified
Q84: A country's production possibilities curve is concave
Q85: Q86: Q87: The slope of an individual's production possibilities Q88: If you move from a point on Q90: The Principle of Increasing Opportunity Cost indicates Q91: Q92: A point on Joseph's production possibilities curve Q93: Point A on a production possibilities curve,where Q94: Unlock this Answer For Free Now! View this answer and more for free by performing one of the following actions Scan the QR code to install the App and get 2 free unlocks Unlock quizzes for free by uploading documents![]()
![]()
![]()
![]()

