The figure below shows the U.S.dollar-Canadian dollar nominal exchange rate from January 1971 to March 2008.
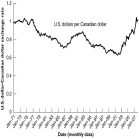
-During the first half of the 1970s,the Canadian dollar
A) traded roughly at par with the U.S.dollar.
B) traded above par with the U.S.dollar.
C) traded below par with the U.S.dollar.
D) was at its fundamental value.
E) was undervalued.
Correct Answer:
Verified
Q16: The following table provides nominal exchange rates
Q17: If the nominal exchange rate is 3.045
Q18: If the nominal exchange rate is 1.235
Q19: A currency appreciation is a(n)
A) increase in
Q20: The rate at which two currencies can
Q22: The figure below shows the U.S.dollar-Canadian dollar
Q23: When the nominal exchange decreases from 0.82
Q24: When the nominal exchange increases from 40.1
Q25: During summer 2002,the nominal exchange rate was
Q26: When the nominal exchange increases from 78
Unlock this Answer For Free Now!
View this answer and more for free by performing one of the following actions

Scan the QR code to install the App and get 2 free unlocks

Unlock quizzes for free by uploading documents