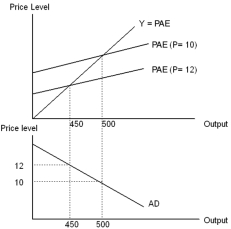
-The top and bottom panels of the diagram above show the relationship between the
A) short-run and the long-run equilibrium output.
B) planned aggregate expenditure curve and the aggregate demand curve.
C) real-balance effect and the Fisher effect.
D) nominal and the real expenditure curves.
E) real-balances effect and the foreign trade effect.
Correct Answer:
Verified
Q29: Which of the following will shift the
Q30: Which of the following shifts the aggregate
Q31: Q32: The idea that a change in the Q33: Suppose a stock market crash decreases the Q35: When the price level rises,planned aggregate expenditure Q36: One explanation for the inverse relationship between Q37: A shift in the position of the Q38: Which of the following shifts the aggregate Q39: If everything else is held constant,a decrease![]()
Unlock this Answer For Free Now!
View this answer and more for free by performing one of the following actions

Scan the QR code to install the App and get 2 free unlocks

Unlock quizzes for free by uploading documents