 Figure 22-10: General Mills Marketing Dashboard Chart "B"
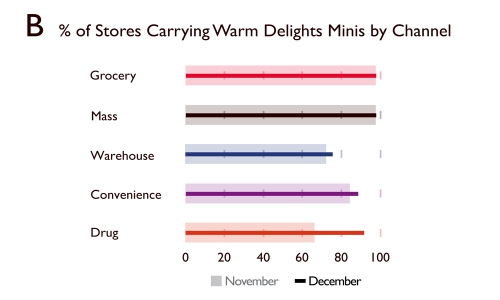
-Consider Figure 22-10: General Mills Marketing Dashboard Chart "B" above.As part of the Warm Delights team at General Mills,you are asked to analyze and interpret the marketing dashboard for Warm Delights Minis.After a careful analysis of Chart "B," you conclude the following:
A) the drug store channel has dramatically increased the average number of flavors Warm Delights Minis carried per store from November to December.
B) the drug store channel has dramatically increased monthly unit sales of Warm Delight Minis from November to December.
C) the drug store channel has dramatically increased monthly sales revenues of Warm Delights Minis from November to December.
D) the drug store channel has seen a dramatic increase in the percentage of stores carrying Warm Delights Minis from November to December.
E) the drug store channel has seen a dramatic decrease in the percentage of stores carrying Warm Delights Minis from November to December.
Correct Answer:
Verified
Q141: Marketing ROI (return on investment) is an
Q233: Q234: Which of the following types of test Q236: of the following are distribution channels General Q237: marketing manager looks for two kinds of Q239: What is a sales response function? Q240: Betty Crocker marketing team that developed Warm Q242: are the advantages and disadvantages of the Q243: is the difference between line and staff Q341: Explain what a Gantt chart is and![]()
Unlock this Answer For Free Now!
View this answer and more for free by performing one of the following actions

Scan the QR code to install the App and get 2 free unlocks

Unlock quizzes for free by uploading documents