 Figure 13-5A
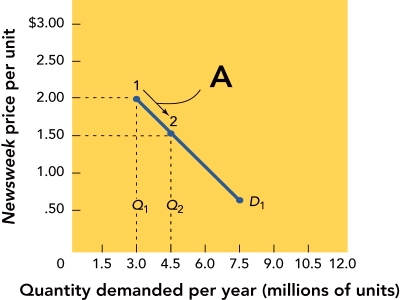
-Figure 13-5A above shows that when the quantity demanded moves from 3.0 to 4.5 million units along the demand curve D1,the profit
A) increases from $1.50 to $2.00 per unit.
B) decreases from $2.00 to $1.50 per unit.
C) stays the same per unit.
D) increases from $0.50 to $1.50 per unit.
E) Figure 13-5A does not indicate what happens to profit when the quantity demanded changes.
Correct Answer:
Verified
Q167: Walmart uses which pricing strategy that affects
Q177: vertical axis of a demand curve graph
Q178: estimating demand,price is not the only factor
Q180: manufacturing company that introduces a product must
Q182: There are a lot of skateboards on
Q183: average amount of money received for selling
Q184: Forever Quilting is a small company that
Q185: Which of the following illustrates a shift
Q186: Campbell Soup spent seven years and $55
Q186: ![]()
Unlock this Answer For Free Now!
View this answer and more for free by performing one of the following actions

Scan the QR code to install the App and get 2 free unlocks

Unlock quizzes for free by uploading documents