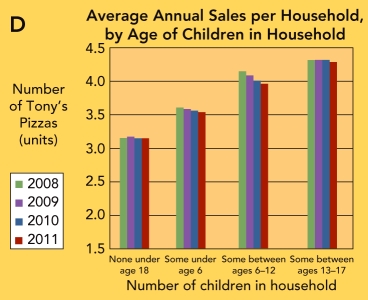
 Figure 8-6D: Average Annual Sales per Household of Tony's Pizza,
by Age of Children in Household
-Figure 8-6D above shows average annual unit sales per household,by age of children in household for Tony's Pizza.Analyze this chart.What findings would you present to a supervisor?
Correct Answer:
Verified
View Answer
Unlock this answer now
Get Access to more Verified Answers free of charge
Q267: Briefly explain what a marketing experiment is.
Q279: Explain why measures of success are important
Q285: principal ways to collect new or primary
Q286: is a panel? How is it used
Q287: is neuromarketing? What does it do? Why
Q292: the elements of an information technology system
Q293: the data has been collected and analyzed,it
Q295: is the difference between a semantic differential
Q303: Marketing information or data consists of secondary
Q321: Briefly explain the best-known statistical method used
Unlock this Answer For Free Now!
View this answer and more for free by performing one of the following actions

Scan the QR code to install the App and get 2 free unlocks

Unlock quizzes for free by uploading documents