Which of the graphs below is the correct depiction of the yield curve given the data on the three zero coupon bonds in the table below?
Zero Coupon Bond Prices and Yields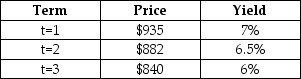
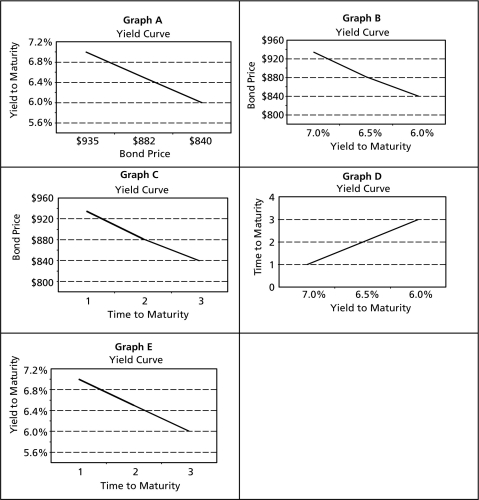
A) Graph A
B) Graph B
C) Graph C
D) Graph D
E) Graph E
Correct Answer:
Verified
Q15: The Associated Dry Goods Corp.zero coupon bond
Q16: Consider a $1,000 face value zero coupon
Q17: How much should an investor pay for
Q18: What is the yield to maturity of
Q19: The real rate of interest is 2%
Q21: Consider a 35 year coupon bond with
Q22: Assume that Microsoft bonds have just left
Q23: In September 2000 the Pullman Group arranged
Q24: Schlitz Brewery Inc.bonds are trading today for
Q25: Consider a 30 year coupon bond with
Unlock this Answer For Free Now!
View this answer and more for free by performing one of the following actions

Scan the QR code to install the App and get 2 free unlocks

Unlock quizzes for free by uploading documents