Exhibit 16-1
The figure below shows a sine wave at one point of a string as a function of time. 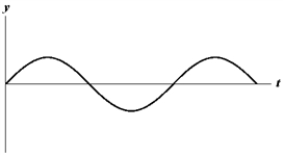 Use the exhibit to answer the following question(s) .
-Refer to Exhibit 16-1.Which of the graphs below shows a wave where the amplitude and frequency are each reduced in half?
A) 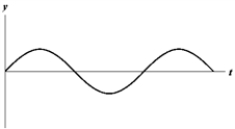
B) 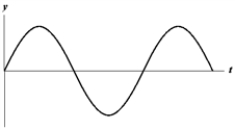
C) 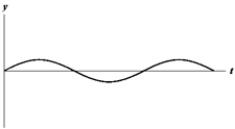
D) 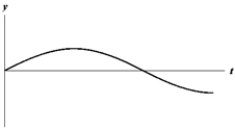
E) 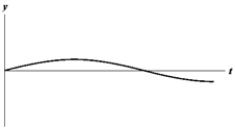
Correct Answer:
Verified
Q21: To transmit four times as much energy
Q23: Find the period of a wave of
Q24: Ariel claims that a pulse is described
Q24: Exhibit 16-3
Four wave functions are given below.
I.y(x,
Q25: A student attaches a length of nylon
Q27: You are holding on to one end
Q28: Exhibit 16-3
Four wave functions are given below.
I.y(x,
Q29: The wave equation is written down in
Q34: Earthquake waves are classified as P waves
Q38: A piano wire of length 1.5 m
Unlock this Answer For Free Now!
View this answer and more for free by performing one of the following actions

Scan the QR code to install the App and get 2 free unlocks

Unlock quizzes for free by uploading documents