Essay
Use the following supply schedule for cherries to draw a graph of the supply curve. Be sure to label the supply curve and each axis, and show each point on the supply curve.
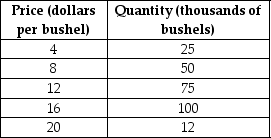
Correct Answer:
Verified
Related Questions
Q106: Which of the following would shift the
Q110: Which of the following would shift the
Q121: Figure 3-4 Q122: Figure 3-4 Q128: Explain the differences between a change in Q139: Figure 3-4 Q140: What is the law of supply? What Q174: Figure 3-2 Q220: In February, market analysts predict that the Q246: Figure 3-3 Unlock this Answer For Free Now! View this answer and more for free by performing one of the following actions Scan the QR code to install the App and get 2 free unlocks Unlock quizzes for free by uploading documents
![]()
![]()
![]()
![]()
![]()

