Figure 6.2 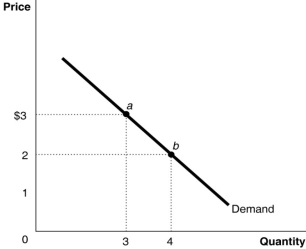 Figure 6.2 represents the demand for ice cream cones.
-Refer to Figure 6.2.Which of the following statements is true?
A) Points a and b are the utility-maximising quantities of ice cream cones at two different prices of ice cream.
B) Points a and b may not necessarily be the utility-maximising quantities of ice cream cones at two different prices because we have no information on the consumer's budget or the price of other goods.
C) Point a could be a utility-maximising choice if the price is $3, but point b may not be because we have no information on the marginal utility per dollar when price changes.
D) Points a and b are derived independently of the utility-maximising model.
Correct Answer:
Verified
Q108: The increase in consumption of a good
Q109: Which of the following is true along
Q111: Goods with upward-sloping demand curves are referred
Q111: What is marginal utility and what is
Q112: For what type of good will the
Q117: Eliza consumes 12 cappuccinos and 8 apple
Q119: Arnie Ziffel has $20 per week to
Q126: The demand curve for a Giffen good
Q132: We can derive the market demand curve
Q134: Economists Robert Jensen and Nolan Miller reasoned
Unlock this Answer For Free Now!
View this answer and more for free by performing one of the following actions

Scan the QR code to install the App and get 2 free unlocks

Unlock quizzes for free by uploading documents