Figure 6.2 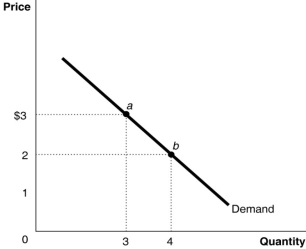 Figure 6.2 represents the demand for ice cream cones.
-Refer to Figure 6.2.When the price of ice cream cones increases from $2 to $3, quantity demanded decreases from 4 ice cream cones to 3 ice cream cones.This change in quantity demanded is due to
A) the price and output effects.
B) the income and substitution effects.
C) the law of diminishing marginal utility.
D) the fact that marginal willingness to pay falls.
Correct Answer:
Verified
Q100: What is the substitution effect of an
Q100: Which of the following describes the substitution
Q102: In order to derive an individual's demand
Q104: After getting an A on your economics
Unlock this Answer For Free Now!
View this answer and more for free by performing one of the following actions

Scan the QR code to install the App and get 2 free unlocks

Unlock quizzes for free by uploading documents