Suppose Argyle Sachs has to choose between building a smaller sweater factory and a larger sweater factory. In the following graph, the relationship between costs and output for the smaller factory is represented by the curve ATC1, and the relationship between costs and output for the larger factory is represented by the curve ATC2.
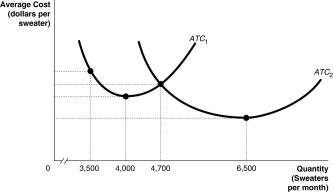 a. If Argyle expects to produce 3600 sweaters per month, should he build a smaller factory or a larger factory? Briefly explain.
b. If Argyle expects to produce 5000 sweaters per month, should he build a smaller factory or a larger factory? Briefly explain.
c. If the average cost of producing sweaters is lower in the larger factory when Argyle produces 6500 sweaters per week, why isn't it also lower when Argyle produces 4000 sweaters per week?
Correct Answer:
Verified
View Answer
Unlock this answer now
Get Access to more Verified Answers free of charge
Q251: The slope of an isoquant measures
A) the
Q255: Which of the following statements explains the
Q255: Assume that you observe the long-run average
Q261: An important reason why diseconomies of scale
Q262: An isocost line shows
A)all the possible combinations
Q265: If a firm is experiencing diseconomies of
Q269: Higher isocost lines correspond to higher
A)profits.
B)total costs
Q272: What is minimum efficient scale? What is
Q276: The absolute value of the slope of
Q277: An isoquant shows
A)the combinations of two goods
Unlock this Answer For Free Now!
View this answer and more for free by performing one of the following actions

Scan the QR code to install the App and get 2 free unlocks

Unlock quizzes for free by uploading documents