Figure 10.8 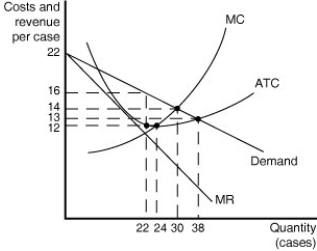 Figure 10.8 shows cost and demand curves for a monopolistically competitive producer of iced tea.
-Refer to Figure 10.8.Based on the diagram, one can conclude that
A) some existing firms will exit the market.
B) new firms will enter the market.
C) the industry is in long-run equilibrium.
D) firms achieve productive efficiency.
Correct Answer:
Verified
Q104: A monopolistically competitive firm should lower its
Q109: A profit-maximising monopolistically competitive firm produces and
Q110: Figure 10.8 Q111: For a profit-maximising monopolistically competitive firm, for![]()
Unlock this Answer For Free Now!
View this answer and more for free by performing one of the following actions

Scan the QR code to install the App and get 2 free unlocks

Unlock quizzes for free by uploading documents