Figure 10.10 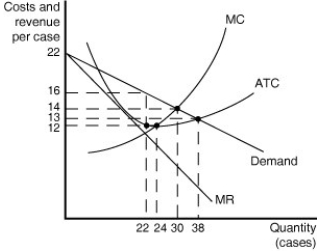 Figure 10.10 shows cost and demand curves for a monopolistically competitive producer of iced tea.
-Refer to Figure 10.10.to answer the following questions.
a.What is the profit-maximising output level?
b.What is the profit-maximising price?
c.At the profit-maximising output level, how much profit will be realised?
d.Does this graph most likely represent the long run or the short run? Why?
__________________________________________________________________________________________________________________________________________________________________________________________
Correct Answer:
Verified
View Answer
Unlock this answer now
Get Access to more Verified Answers free of charge
Q104: A monopolistically competitive firm should lower its
Q105: Unlike a perfectly competitive firm, a monopolistic
Q114: Figure 10.8 Q119: A monopolistically competitive industry that earns economic Q119: If a perfectly competitive firm maximises short-run Q132: You have just opened a new Italian Q133: A monopolistically competitive firm earning profits in Q134: You are planning to open a new Q135: Assuming that the total market size remains Q140: If a typical monopolistically competitive firm is![]()
Unlock this Answer For Free Now!
View this answer and more for free by performing one of the following actions

Scan the QR code to install the App and get 2 free unlocks

Unlock quizzes for free by uploading documents