Multiple Choice
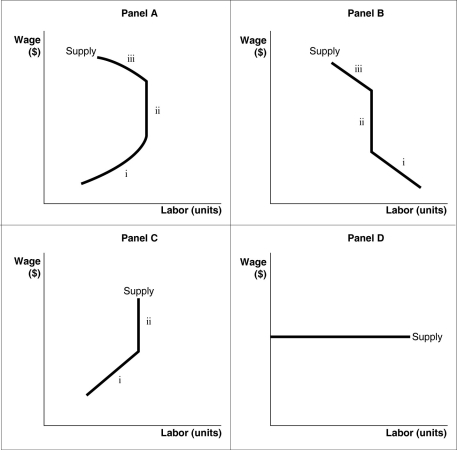
-Refer to Figure 12-3. Which of the panels in the diagram best represents an individual's labour supply curve?
A) Panel A
B) Panel B
C) Panel C
D) Panel D
Correct Answer:
Verified
Related Questions
Q84: Figure 12.3 Q86: An individual's labour supply curve shows Q91: Figure 12.3 Q91: Explain how the market for opticians is Q92: Figure 12.4 Q93: The combined effect (both income and substitution) Q94: Figure 12.4 Q95: If Molly Bee increases her work hours Q96: How will an increase in population affect Q100: Figure 12.4 Unlock this Answer For Free Now! View this answer and more for free by performing one of the following actions Scan the QR code to install the App and get 2 free unlocks Unlock quizzes for free by uploading documents![]()
A) the![]()
![]()
![]()
![]()

