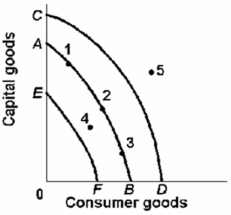
-Refer to the above diagram.Assume a nation's current production possibilities are represented by the curve AB.Positive economic growth would best be indicated by a:
A) shift in the curve from AB to CD.
B) shift in the curve from AB to EF.
C) movement from point 1 to point 2.
D) movement from point 3 to point 4.
Correct Answer:
Verified
Q57: Q59: Which of the following is correct? Q63: Real GDP or total output in any Q64: Between 1945 - 2011,the labour force in Q71: The historical reallocation of labour from agriculture Q76: Economic growth can best be portrayed as Q78: The achievement of full employment through time Q84: The most important contributor to increases in Q86: Over the past half century the growth Q96: Between 1946 - 2011, the annual Canadian![]()
A) total
Unlock this Answer For Free Now!
View this answer and more for free by performing one of the following actions

Scan the QR code to install the App and get 2 free unlocks

Unlock quizzes for free by uploading documents