Refer to the supply and demand graph for a public good.Line segment ad represents the amount at Q1 by which the: 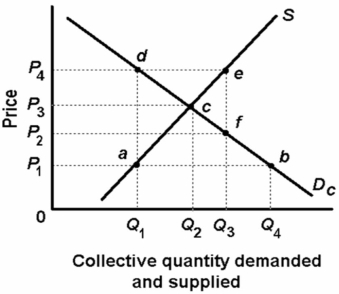
A) marginal benefit of this public good is less than the marginal cost.
B) total benefit of this public good is less than the total cost.
C) marginal benefit of this public good is greater than the marginal cost.
D) total benefit of this public good is greater than the total cost.
Correct Answer:
Verified
Q48: Answer the next question on the basis
Q49: Answer the question based on the following
Q50: Answer the question based on the following
Q52: The following information is for a public
Q54: The following information is for four highway
Q55: Ed,Mike,and Scott are the only three people
Q56: Refer to the information below: 
Q58: The following data are for a series
Q67: Suppose that Mick and Cher are the
Q82: Cost-benefit analysis attempts to
A)compare the real worth,
Unlock this Answer For Free Now!
View this answer and more for free by performing one of the following actions

Scan the QR code to install the App and get 2 free unlocks

Unlock quizzes for free by uploading documents