Refer to the below supply and demand graph.Point A represents the current equilibrium level of output of this product and point B represents the optimal level of output from society's perspective.This supply and demand graph indicates that there is (are) : 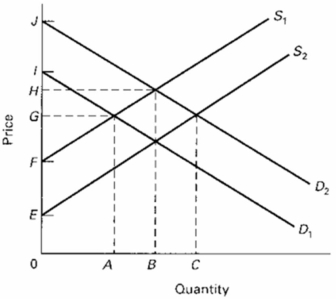
A) positive externalities to the production of this product.
B) negative externalities to the production of this product.
C) an overallocation of resources to the production of this product.
D) a negative externality from the production of this product.
Correct Answer:
Verified
Q65: In a market where there are external
Q69: Refer to the below diagram of the
Q76: Refer to the supply and demand graph
Q78: By levying taxes on households and businesses,
Q79: Which of these is an example of
Q81: Which of the following is an example
Q85: If there are external benefits or positive
Q88: If there are external benefits or positive
Q94: The Coase Theorem states that:
A)government should levy
Q95: If a good that generates negative externalities
Unlock this Answer For Free Now!
View this answer and more for free by performing one of the following actions

Scan the QR code to install the App and get 2 free unlocks

Unlock quizzes for free by uploading documents