The graphs below refer to two separate product markets.Assume that society's optimal level of output in each market is Q0 and that government purposely shifts the market supply curve from S to S1 in diagram (a) and from S to S2 in diagram (b) .We can conclude that the government is correcting for: 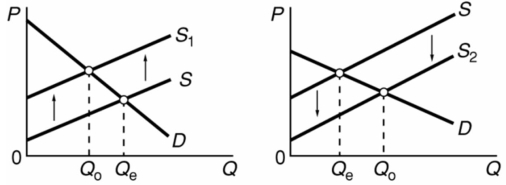
A) negative externalities in diagram (a) and positive externalities in diagram (b) .
B) positive externalities in diagram (a) and negative externalities in diagram (a) .
C) negative externalities in both diagrams.
D) positive externalities in both diagrams.
Correct Answer:
Verified
Q79: Which of these is an example of
Q84: The proposition that under some circumstances externalities
Q91: Suppose that a large tree on Shawn's
Q93: The Coase Theorem:
A)applies only to circumstances in
Q98: One condition for individual bargaining to occur
Q106: There is little incentive for an individual
Q109: It has been proposed that a government
Q110: The creation of a market for pollution
Q144: If the production of a product or
Q159: A market for pollution rights can be
Unlock this Answer For Free Now!
View this answer and more for free by performing one of the following actions

Scan the QR code to install the App and get 2 free unlocks

Unlock quizzes for free by uploading documents