The graphs below refer to two separate product markets.Assume that society's optimal level of output in each market is Q0 and that government purposely shifts the market supply curve from S to S1 in diagram (a) and from S to S2 in diagram (b) .The shift of the supply curve from S to S1 in diagram (a) might be caused by a per unit: 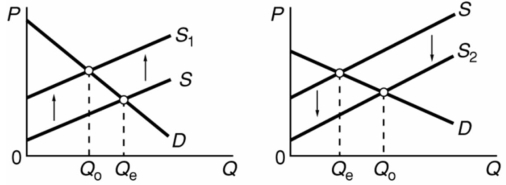
A) subsidy paid to the producers of this product.
B) tax on the producers of this product.
C) subsidy paid to the buyers of this product.
D) tax on the buyers of this product.
Correct Answer:
Verified
Q11: There is a positive relationship between equilibrium
Q17: The principle that private negotiation can resolve
Q92: Refer to the below competitive market diagram
Q94: The graphs below refer to two separate
Q95: Refer to the diagram in which S
Q96: Near an ocean beach, a high-rise building
Q100: Refer to the below supply and demand
Q101: The socially optimal amount of pollution moderation
Q104: The optimal reduction of an externality occurs
Q115: Refer to the information below.Which of the
Unlock this Answer For Free Now!
View this answer and more for free by performing one of the following actions

Scan the QR code to install the App and get 2 free unlocks

Unlock quizzes for free by uploading documents