Multiple Choice
The following graph represents a competitive market for a product.where the government now has introduced a price floor of 0C.Which area in the graph represents the producers' revenue after the imposition of the price floor? 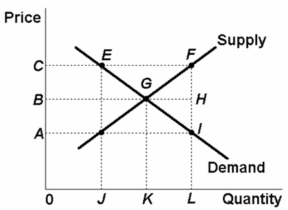
A) 0CFL
B) 0CEJ
C) 0BGK
D) 0BHL
Correct Answer:
Verified
Related Questions
Q147: Price floors and ceiling prices:
A) both cause
Q156: An effective price floor on wheat will
A)
Unlock this Answer For Free Now!
View this answer and more for free by performing one of the following actions

Scan the QR code to install the App and get 2 free unlocks

Unlock quizzes for free by uploading documents