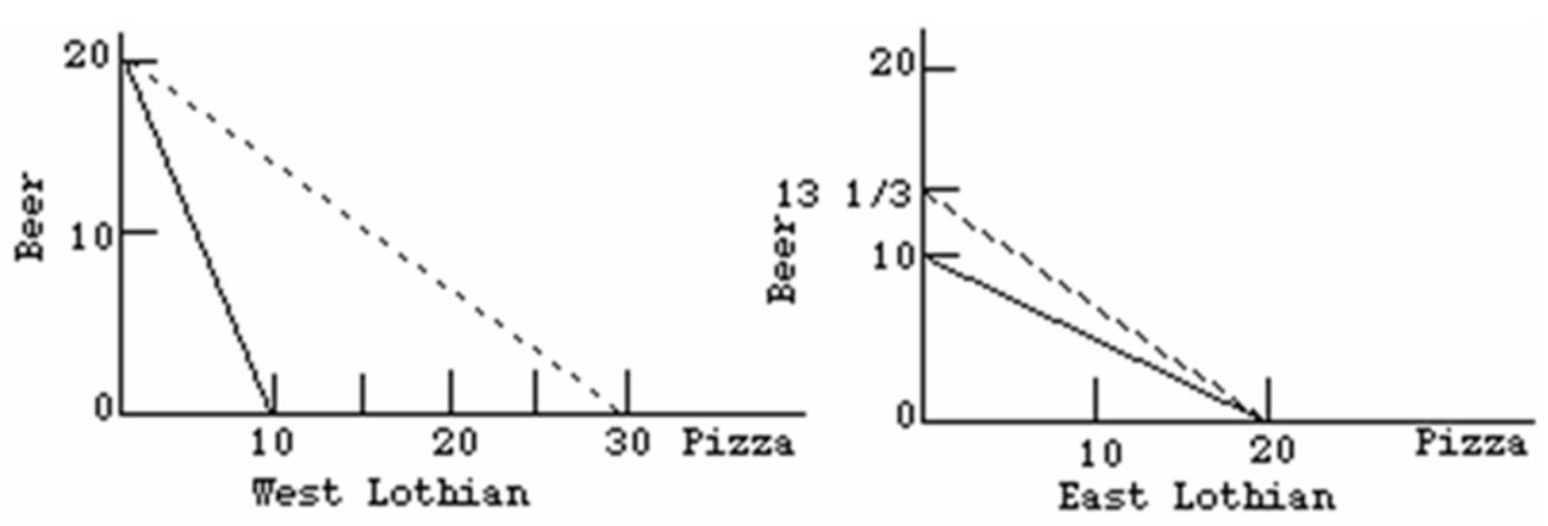
-Refer to the above diagrams.The solid lines are production possibilities curves;the dashed lines are trading possibilities curves.The data contained in the production possibilities curves are based on the assumption of:
A) imperfect substitutability of resources as between beer and pizza production.
B) constant costs.
C) decreasing costs.
D) increasing costs.
Correct Answer:
Verified
Q9: Given the following production possibilities schedules,it can
Q18: Which of the following is an example
Q21: The best example of a capital-intensive good
Q26: When Sally can paint a house and
Q27: Differences in production efficiencies among nations in
Q28: Which products were the leading imports of
Q34: Consider two countries which trade with each
Q35: The best example of a land-intensive commodity
Q36: Several new players have significantly expanded their
Q40: Which products were the leading exports of
Unlock this Answer For Free Now!
View this answer and more for free by performing one of the following actions

Scan the QR code to install the App and get 2 free unlocks

Unlock quizzes for free by uploading documents