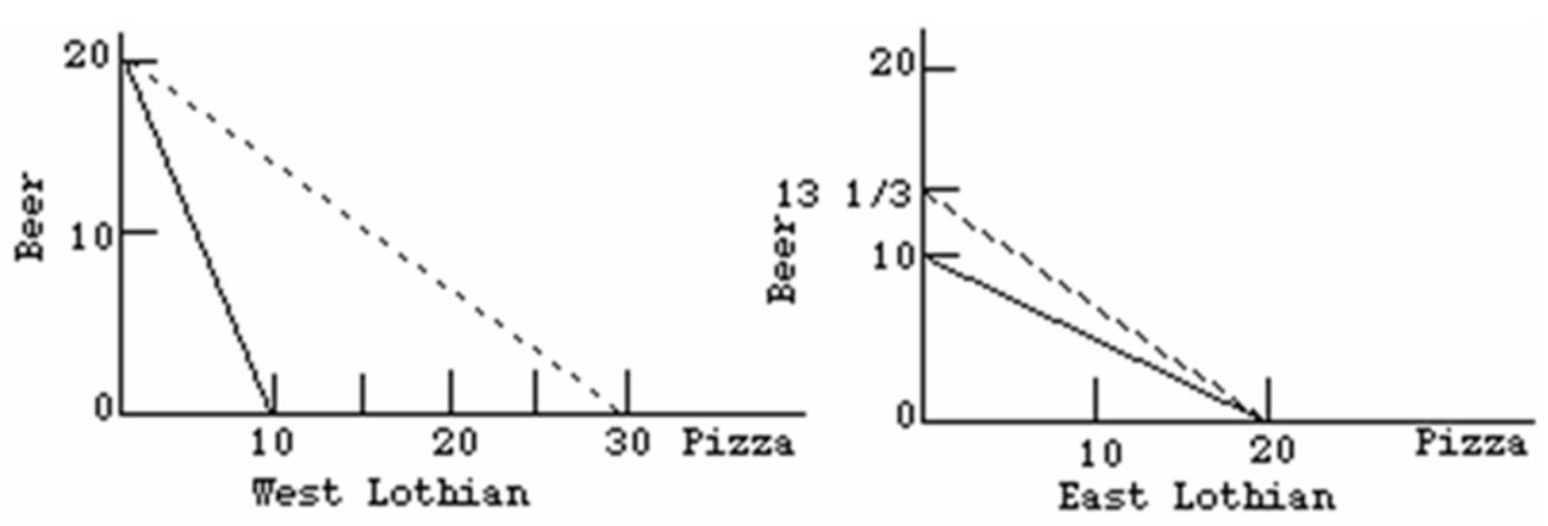
-Refer to the above diagrams.The solid lines are production possibilities curves;the dashed lines are trading possibilities curves.The opportunity cost of producing a:
A) pizza is 2 beers in both countries.
B) beer is 1/2 a pizza in both countries.
C) pizza in East Lothian is 1 beer.
D) beer in West Lothian is 1/2 a pizza.
Correct Answer:
Verified
Q9: Given the following production possibilities schedules,it can
Q14: The following is the Production possibilities tables
Q28: Which products were the leading imports of
Q30: In terms of absolute volume, world trade
Q33: Canadian exports of goods and services are
Q34: Consider two countries which trade with each
Q36: Several new players have significantly expanded their
Q39: Which of the following is an example
Q40: Which products were the leading exports of
Q68: Which of the following is an example
Unlock this Answer For Free Now!
View this answer and more for free by performing one of the following actions

Scan the QR code to install the App and get 2 free unlocks

Unlock quizzes for free by uploading documents