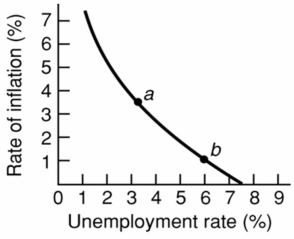
-Refer to the above diagram for a specific economy.Which of the following best describes the relationship shown by this curve?
A) The demand for labor is large when the rate of inflation is small.
B) When the rate of unemployment is high,the rate of inflation is high.
C) The rate of inflation and the rate of unemployment are inversely related.
D) The rate of inflation and the rate of unemployment are directly related.
Correct Answer:
Verified
Q60: Q61: An adverse aggregate supply shock could result Q64: The Phillips Curve reveals that with a Q65: In the long-run, any inflation that occurs Q72: The Phillips Curve suggests a tradeoff between: Q73: A rightward shift of the Phillips Curve Q75: A major adverse aggregate supply shock: Q76: The Phillips Curve is based on the Q78: The basic problem portrayed by the Phillips Q94: Adverse aggregate supply shocks would result in![]()
A)price
A)automatically shifts
A)a
Unlock this Answer For Free Now!
View this answer and more for free by performing one of the following actions

Scan the QR code to install the App and get 2 free unlocks

Unlock quizzes for free by uploading documents