Solved

-In the Above Figure AD1 and AS1 Represent the Original

Question 150

Multiple Choice

  -In the above figure AD<sub>1</sub> and AS<sub>1</sub> represent the original aggregate supply and demand curves and AD<sub>2</sub> and AS<sub>2</sub> show the new aggregate demand and supply curves.The changes in aggregate demand and supply in the above diagram produce: A)  a higher price level. B)  an expansion of real output and a stable price level. C)  an expansion of real output and a higher price level. D)  a decline in real output and a stable price level.
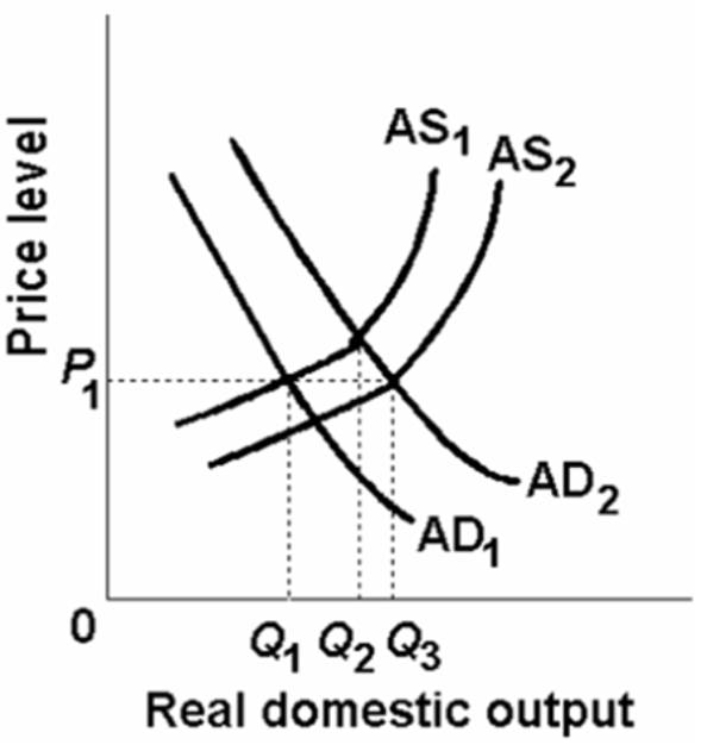
-In the above figure AD1 and AS1 represent the original aggregate supply and demand curves and AD2 and AS2 show the new aggregate demand and supply curves.The changes in aggregate demand and supply in the above diagram produce:


A) a higher price level.
B) an expansion of real output and a stable price level.
C) an expansion of real output and a higher price level.
D) a decline in real output and a stable price level.

Correct Answer:

verifed

Verified

Unlock this answer now
Get Access to more Verified Answers free of charge

Related Questions

Unlock this Answer For Free Now!

View this answer and more for free by performing one of the following actions

qr-code

Scan the QR code to install the App and get 2 free unlocks

upload documents

Unlock quizzes for free by uploading documents