Which of the following equations correctly represents the data below? 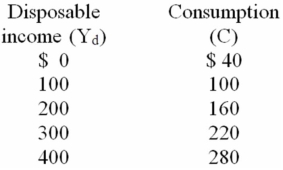
A) Yd = 40 + .6C
B) C = 60 + .4Yd
C) C = 40 + .6Yd
D) C = .6Yd
Correct Answer:
Verified
Q6: A decline in disposable income
A)increases consumption by
Q15: Refer to the data below.When plotted on
Q20: As disposable income increases, consumption
A) and saving
Q22: The consumption schedule relates:
A)consumption to the level
Q31: If the MPC is .8 and the
Q33: The saving schedule is such that as
Q35: The consumption schedule shows:
A)a direct relationship between
Q35: The saving schedule is drawn on the
Q36: The relationship between consumption and disposable income
Q38: Given the consumption schedule, it is possible
Unlock this Answer For Free Now!
View this answer and more for free by performing one of the following actions

Scan the QR code to install the App and get 2 free unlocks

Unlock quizzes for free by uploading documents