Multiple Choice
Which graph most appropriately shows the density of water plotted against temperature? 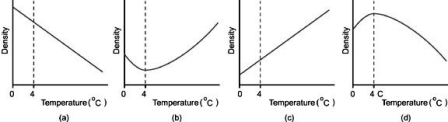
A) graph a
B) graph b
C) graph c
D) graph d
Correct Answer:
Verified
Related Questions
Q21: Why are polar oceans most fertile in
Q23: Consider a lake that is uniformly 10°C.
Q23: Why does adding heat to ice-water disfavor
Q24: Describe what happens to an ice cube
Q27: Why does ice form at the surface
Q28: Suppose that water is used in a
Unlock this Answer For Free Now!
View this answer and more for free by performing one of the following actions

Scan the QR code to install the App and get 2 free unlocks

Unlock quizzes for free by uploading documents