The accompanying chart shows the number of books written by each author in a collection of cookbooks. What type of data is being represented? 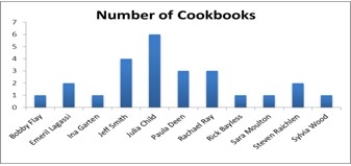
A) Quantitative, ordinal
B) Quantitative, ratio
C) Qualitative, nominal
D) Qualitative, ordinal
Correct Answer:
Verified
Q17: A bar chart may be displayed horizontally.
Q18: The relative frequency of a category is
Q19: A frequency distribution for qualitative data groups
Q20: A polygon connects a series of neighboring
Q21: A city in California spent $6 million
Q23: The following is a list of five
Q24: The following data represent scores on a
Q25: For which of the following data sets
Q26: A city in California spent $6 million
Q27: Which of the following best describes a
Unlock this Answer For Free Now!
View this answer and more for free by performing one of the following actions

Scan the QR code to install the App and get 2 free unlocks

Unlock quizzes for free by uploading documents