Automobiles traveling on a road with a posted speed limit of 65 miles per hour are checked for speed by a state police radar system. The following table is a frequency distribution of speeds. 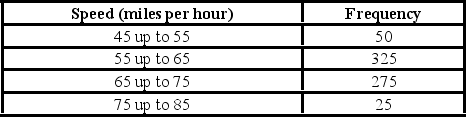 What proportion of the cars traveled at least 55 but less than 65 miles per hour?
A) 0.33
B) 0.48
C) 0.56
D) 0.80
Correct Answer:
Verified
Q58: Consider the following frequency distribution. 
Q59: The following histogram represents the number of
Q60: The following data represent the recent sales
Q61: The accompanying table shows students' scores from
Q62: In the accompanying stem-and-leaf diagram, the values
Q64: The accompanying relative frequency distribution represents the
Q65: In the accompanying stem-and-leaf diagram, the values
Q66: How does an ogive differ from a
Q67: The accompanying relative frequency distribution represents the
Q68: The organization of the Girl Sprouts has
Unlock this Answer For Free Now!
View this answer and more for free by performing one of the following actions

Scan the QR code to install the App and get 2 free unlocks

Unlock quizzes for free by uploading documents