The manager at a water park constructed the following frequency distribution to summarize attendance in July and August. 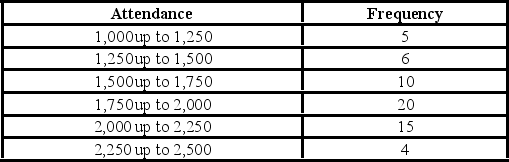 What of the following is the most likely attendance range?
A) 2,000 up to 2,500
B) 1,000 up to 1,750
C) 1,250 up to 1,750
Correct Answer:
Verified
Q83: The statistics professor has kept attendance records
Q84: The following frequency distribution displays the weekly
Q85: A survey conducted by CBS news asked
Q86: What type of relationship is indicated in
Q87: What type of relationship is indicated in
Q89: The following frequency distribution shows the frequency
Q90: The following frequency distribution shows the frequency
Q91: Consider the following stem-and-leaf diagram. 
Q92: Consider the following stem-and-leaf diagram.
Q93: The Statistical Abstract of the United States
Unlock this Answer For Free Now!
View this answer and more for free by performing one of the following actions

Scan the QR code to install the App and get 2 free unlocks

Unlock quizzes for free by uploading documents