The following is return data for a retail sector ETF and energy sector ETF for the years, Year 1 to Year 5. 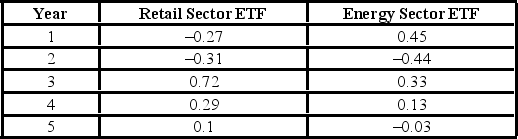 (See the Excel Data File.)
A) What is the arithmetic mean return for each ETF?
B) What is the geometric mean return for each ETF?
C) What is the sample standard deviation for each ETF? Which ETF was riskier over this time period?
D) Given a risk free rate of 5%, what is the Sharpe Ratio for each ETF? Which investment had a better return per unit of risk over this time period?
Correct Answer:
Verified
View Answer
Unlock this answer now
Get Access to more Verified Answers free of charge
Q129: The following table shows the annual returns
Q130: Suppose the wait to pass through immigration
Q131: Suppose the average price for new cars
Q132: The Yearly Prices (rounded to the nearest
Q133: John lives in Los Angeles and hates
Q135: The director of graduate admissions is analyzing
Q136: The following is a list of average
Q137: Suppose the dealer incentive per vehicle for
Q138: The following data are a list of
Q139: Janice Anooshian asks eight of her friends
Unlock this Answer For Free Now!
View this answer and more for free by performing one of the following actions

Scan the QR code to install the App and get 2 free unlocks

Unlock quizzes for free by uploading documents