A sociologist examines the relationship between the poverty rate and several socioeconomic factors. For the 50 states and the District of Columbia (n = 51) , he collects data on the poverty rate (y, in %) , the percent of the population with at least a high school education (x1) , median income (x2, in $1000s) , and the mortality rate per 1,000 residents (x3) . He estimates the following model as y = β0 + β1Education + β2Income + β3Mortality + ε. The following ANOVA table shows a portion of the regression results. 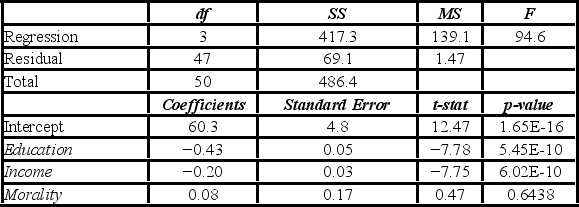 The coefficient of determination indicates that ________.
A) 14% of the variation in the poverty rate is explained by the regression model.
B) 14% of the variation in median incomes is explained by the sample regression equation.
C) 86% of the variation in the poverty rate is explained by the sample regression equation.
D) 86% of the variation in median incomes is explained by the sample regression equation.
Correct Answer:
Verified
Q98: Consider the following sample regression equation
Q99: A marketing analyst wants to examine the
Q100: When estimating Q101: A sociologist examines the relationship between the Q102: The following data for five years of Q104: Which of the following Excel functions returns Q105: The following table shows the number of Q106: Which of the following R functions returns Q107: The following data for five years of Q108: Costco sells paperback books in their retail![]()
Unlock this Answer For Free Now!
View this answer and more for free by performing one of the following actions

Scan the QR code to install the App and get 2 free unlocks

Unlock quizzes for free by uploading documents