A sociologist studies the relationship between a district's average score on a standardized test for 10th-grade students (y), the average school expenditures per student (x1 in $1,000s), and an index of the socioeconomic status of the district (x2). The following model is estimated: Score = β0 + β1Expenditures + β2Index + ε. A portion of the regression results is shown in the accompanying table. 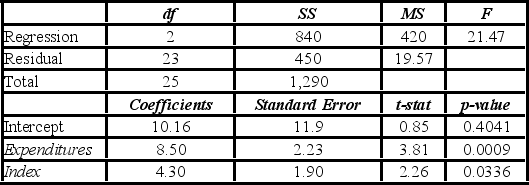 a. Predict a district's average test score if average expenditures are $4,500 and the district's social index is 8.
B) Interpret the slope coefficient for Expenditures.
C) Calculate the standard error of the estimate.
D) Calculate and interpret the coefficient of determination.
E) Calculate the adjusted R2.
Correct Answer:
Verified
b. If Expenditures increase by $...
View Answer
Unlock this answer now
Get Access to more Verified Answers free of charge
Q116: Costco sells paperback books in their retail
Q117: The following table shows the number of
Q118: When estimating Q119: The following data for five years of Q120: The following data for five years of Q122: The following portion of regression results was Q123: A sample of 30 observations provides the Q124: Consider the following sample data: Q125: Consider the following sample data: Q126: An analyst examines the effect that various![]()

Unlock this Answer For Free Now!
View this answer and more for free by performing one of the following actions

Scan the QR code to install the App and get 2 free unlocks

Unlock quizzes for free by uploading documents