Typically, the sales volume declines with an increase of a product price. It has been observed, however, that for some luxury goods the sales volume may increase when the price increases. The following scatterplot illustrates this rather unusual relationship. 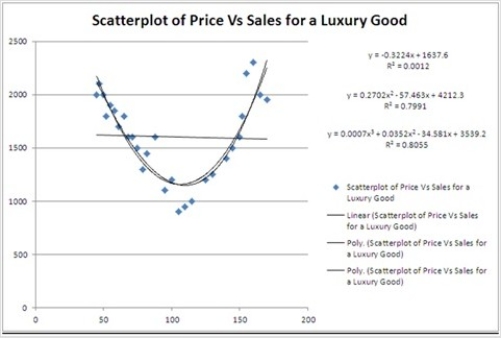 For the considered range of the price, the relationship between Price and Sales should be described by a ________.
A) concave function
B) hyperbola
C) convex function
D) linear function
Correct Answer:
Verified
Q40: The following scatterplot shows productivity and number
Q41: A model in which both the response
Q42: Typically, the sales volume declines with an
Q43: For the exponential model ln(y) = β0
Q44: What R function is used to fit
Q46: Typically, the sales volume declines with an
Q47: The coefficient of determination R2 cannot be
Q48: What does a positive value for price
Q49: For the log-log model ln(y) = β0
Q50: For the logarithmic model ln(y) = β0
Unlock this Answer For Free Now!
View this answer and more for free by performing one of the following actions

Scan the QR code to install the App and get 2 free unlocks

Unlock quizzes for free by uploading documents