The following data show the demand for an airline ticket dependent on the price of this ticket. 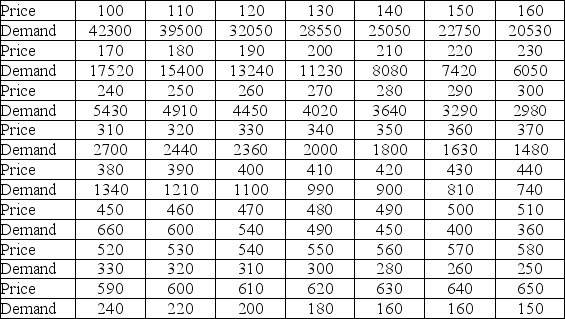 For the assumed cubic and log-log regression models, Demand = β0 + β1Price + β2Price2 + β3Price3 + ε and ln(Demand) = β0 + β1ln(Price) + ε, the following regression results are available.
  Which of the following is the percentage of variation in ln(Demand) explained by the log-log regression model?
A) 98.52%
B) 98.50%
C) 91.39%
D) 97.93%
Correct Answer:
Verified
Q85: Thirty employed single individuals were randomly selected
Q86: The following data show the demand for
Q87: Which of the following regression models is
Q88: The scatterplot shown below represents a typical
Q89: Thirty employed single individuals were randomly selected
Q91: The following data show the demand for
Q92: In which of the following models does
Q93: In which of the following models does
Q94: The following data show the demand for
Q95: The scatterplot shown below represents a typical
Unlock this Answer For Free Now!
View this answer and more for free by performing one of the following actions

Scan the QR code to install the App and get 2 free unlocks

Unlock quizzes for free by uploading documents