The following table shows the annual revenues (in millions of dollars) of a pharmaceutical company over the period 1990-2011. 
 The scatterplot indicates that the annual revenues have an increasing trend. Linear, exponential, quadratic, and cubic models were fit to the data starting with t = 1, and the following output was generated.
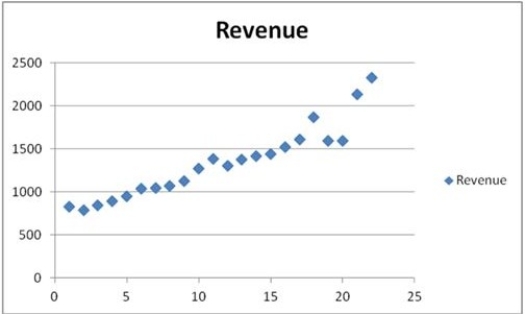
  Which of the following is a linear trend equation?
A)  t = 642.7t + 60.496
B)  t = 642.7 + 60.496t
C)  t = 642.7 + 60.496t2 D) yt = 642.7 + 60.496t + ε
Correct Answer:
Verified
Q67: The _ is a trend model that
Q68: The following table shows the annual revenues
Q69: The following table shows the annual revenues
Q70: The following table shows the annual revenues
Q71: Which of the following formulas is used
Q73: When a time series is analyzed by
Q74: The following table shows the annual revenues
Q75: The following table shows the annual revenues
Q76: In comparison with the linear trend model,
Q77: The following table shows the annual revenues
Unlock this Answer For Free Now!
View this answer and more for free by performing one of the following actions

Scan the QR code to install the App and get 2 free unlocks

Unlock quizzes for free by uploading documents