The following table shows the annual revenues (in millions of dollars) of a pharmaceutical company over the period 1990-2011. 
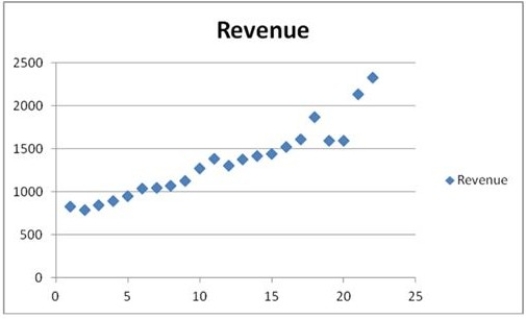 The scatterplot indicates that the annual revenues have an increasing trend. Linear, exponential, quadratic, and cubic models were fit to the data starting with t = 1, and the following output was generated.
  Which of the following is a revenue forecast for 2012 found by the exponential trend equation?
A) About 2 billion and 334 million dollars
B) About 2 billion and 189 million dollars
C) About 2 billion and 141 million dollars
D) About 2 billion and 34 million dollars
Correct Answer:
Verified
Q75: The following table shows the annual revenues
Q76: In comparison with the linear trend model,
Q77: The following table shows the annual revenues
Q78: If the model yt = Tt ×
Q79: In the quadratic trend model, yt =
Q81: When the model yt = Tt ×
Q82: Based on quarterly data collected over the
Q83: The linear trend model, Q84: A seasonal component differs from a cyclical Q85: In the time series decomposition method, to![]()
Unlock this Answer For Free Now!
View this answer and more for free by performing one of the following actions

Scan the QR code to install the App and get 2 free unlocks

Unlock quizzes for free by uploading documents