The following table shows the annual revenues (in millions of dollars) of a pharmaceutical company over the period 1990-2011. 
 The scatterplot indicates that the annual revenues have an increasing trend. Linear, exponential, quadratic, and cubic models were fit to the data starting with t = 1, and the following output was generated.
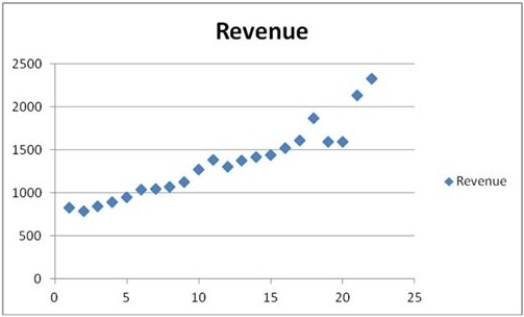
  Which of the following is a revenue forecast for 2012 found by the polynomial trend equation with the best fit?
A) About 2 billion and 149 million dollars
B) About 2 billion and 189 million dollars
C) About 2 billion and 337 million dollars
D) About 2 billion and 34 million dollars
Correct Answer:
Verified
Q58: Which of the following is a similarity
Q59: The past monthly demands are shown below.
Q60: Which of the following is true of
Q61: Which of the following is a centered
Q62: A polynomial trend model that only allows
Q64: When comparing which of the following trend
Q65: Which of the following types of trend
Q66: Which of the following types of trend
Q67: The _ is a trend model that
Q68: The following table shows the annual revenues
Unlock this Answer For Free Now!
View this answer and more for free by performing one of the following actions

Scan the QR code to install the App and get 2 free unlocks

Unlock quizzes for free by uploading documents