The graph in the figure shows the velocity of a particle as it travels along the x-axis. What is the magnitude of the average acceleration of the particle between t = 1.0 s and t = 4.0 s? 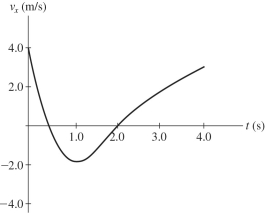
A) 0.33 m/s2
B) 1.7 m/s2
C) 2.0 m/s2
D) 2.5 m/s2
E) 3.0 m/s2
Correct Answer:
Verified
Q120: To determine the height of a bridge
Q125: Abby throws a ball straight up and
Q157: In the absence of air resistance,
Q158: The graph in the figure represents the
Q161: The graph in the figure shows the
Q163: The figure shows a graph of the
Q164: The figure shows the velocity-versus-time graph for
Q165: The figure shows a graph of the
Q166: The graph in the figure shows the
Q167: The figure shows a graph of the
Unlock this Answer For Free Now!
View this answer and more for free by performing one of the following actions

Scan the QR code to install the App and get 2 free unlocks

Unlock quizzes for free by uploading documents